

Why industrial companies run circular pilots but never reach commercial scale
Recovery practices score 57%. Financial tracking scores 9.8%. The bottleneck holding back circular business models is not technical feasibility; it is the absence of unit economics.

Deborah de Wolff
Co-founder & CEO, Liinka4 min read


Across major global corporations in diverse industrial sectors, spanning capital goods, automotive components, packaging, heavy building materials, chemicals, and consumer products, a distinct operational pattern has emerged. Leading enterprises actively promote circular roadmaps, implement pilot recycling programs, and gather product footprint data.
However, when evaluated on financial rigor, unit economics, and commercial monetization, these organizationally mature firms remain surprisingly unprepared.
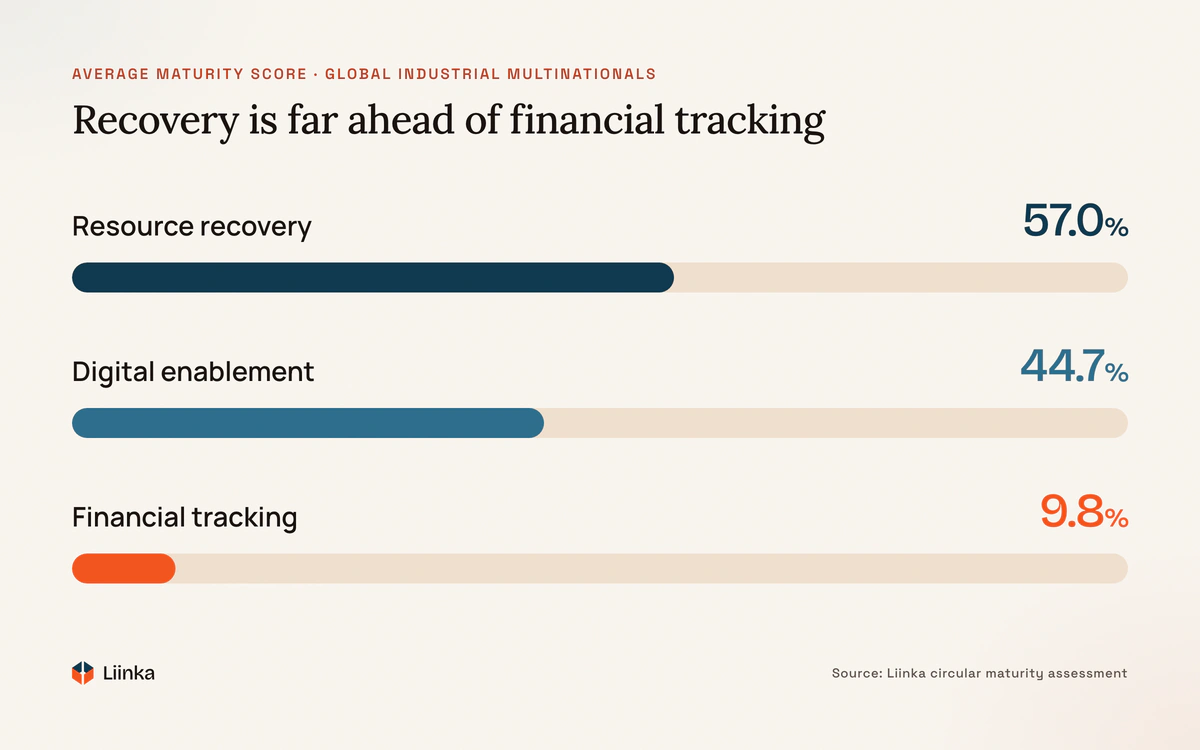
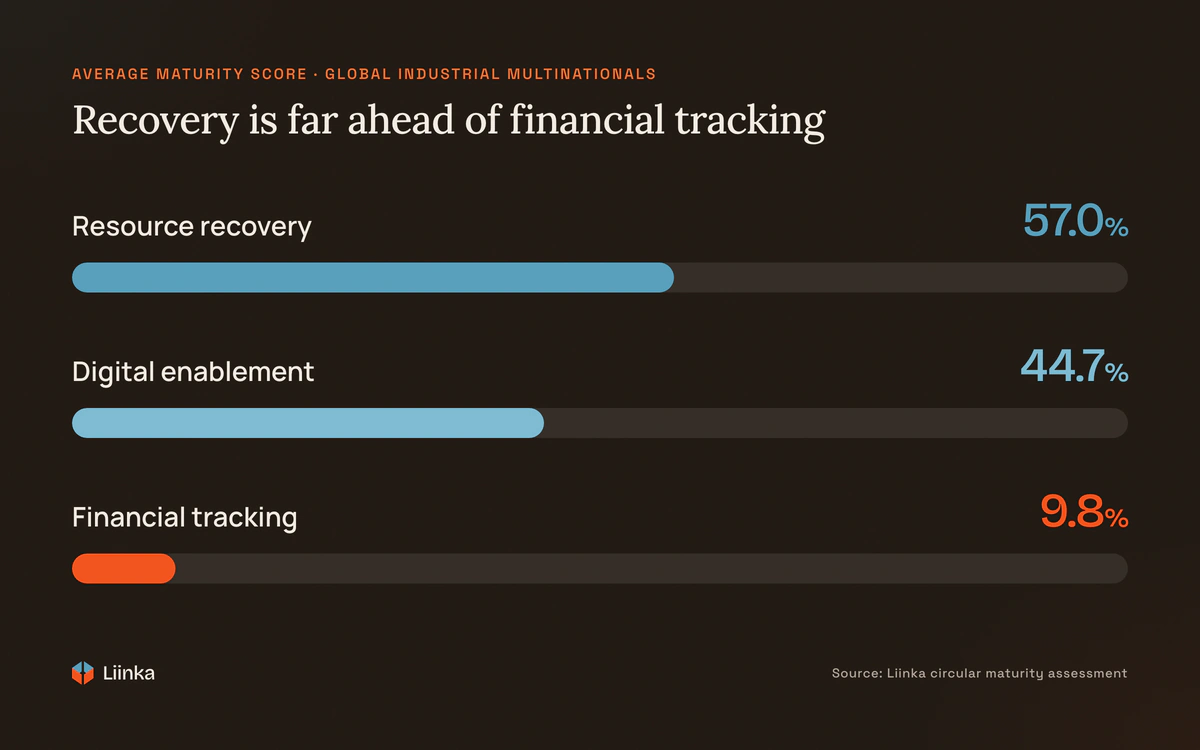
An assessment of circular business model maturity across global industrial multinationals reveals a fundamental imbalance. While technical recovery practices score an average of 57.0% and digital enablement reaches 44.7%, corporate financial tracking languishes at just 9.8%. The underlying bottleneck holding back circular business models is not technical feasibility, but the total absence of unit-level commercial pricing, financial accounting, and finance team ownership.
01
The Financial Vacuum: Zero Visibility into Unit Economics
Companies routinely track environmental metrics and carbon footprints, but circularity hits a wall when brought into corporate finance committees.
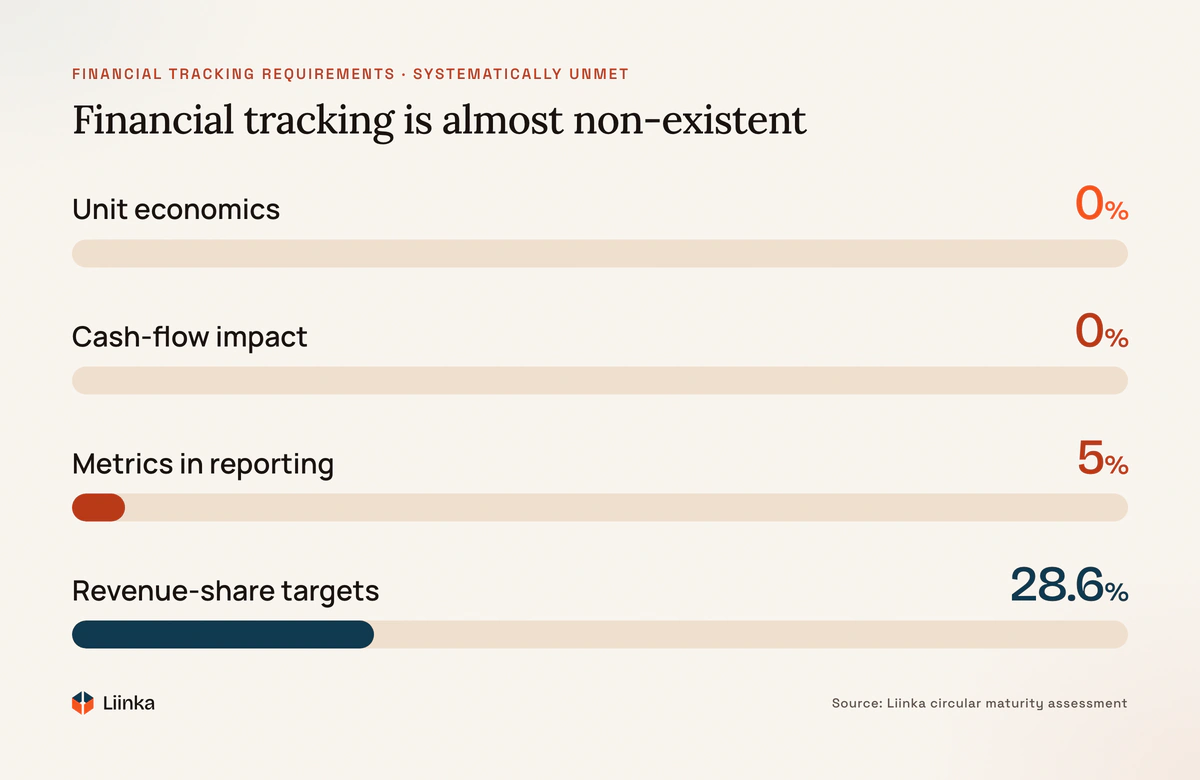
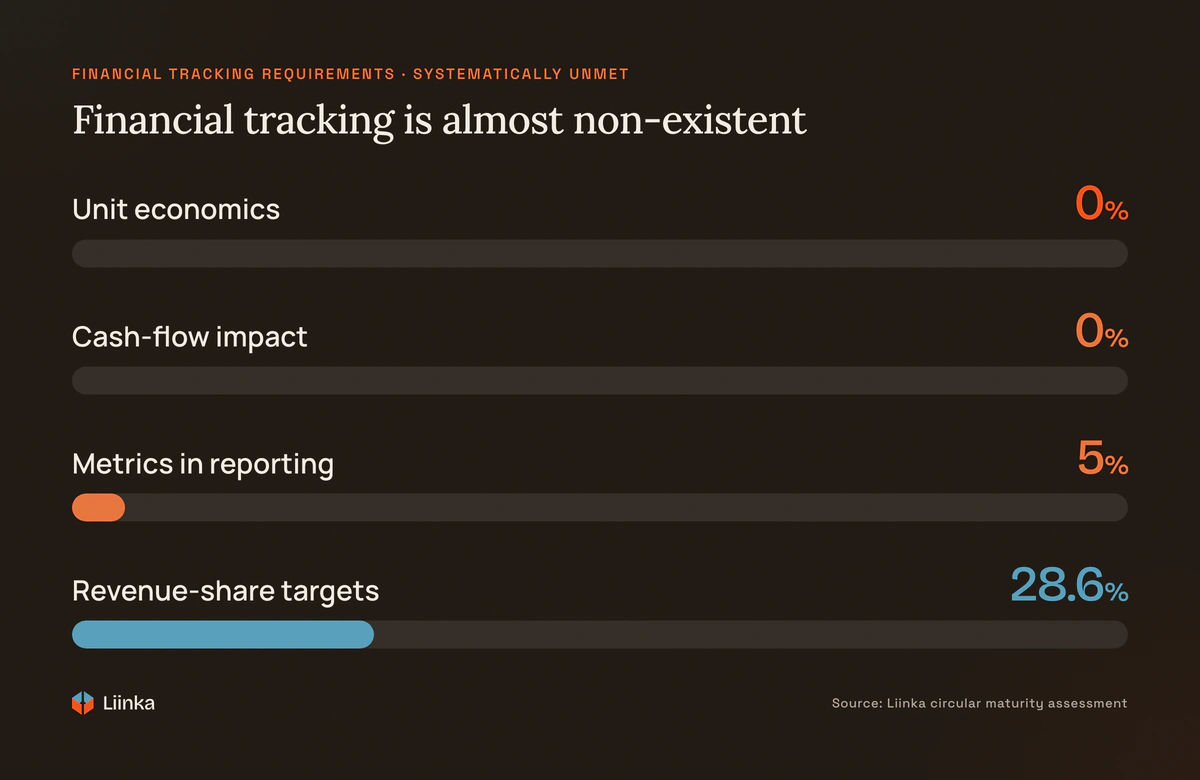
Across all evaluated multinationals, financial tracking requirements were systematically unmet:
- 0% track or understand the unit economics of their circular offerings, such as margin per cycle, cost-to-serve, or residual asset value.
- 0% track how circular business models impact corporate cash flow, working capital, or cost structures as they scale.
- 5% have integrated circular metrics into standard financial reporting or established the finance function as an active owner of the circular business case.
- Only 28.6% explicitly track or set target revenue shares derived from circular offerings.
02
Resource Recovery at Initial Scale: Pilot Programs vs. Closed Loops
While resource recovery recorded a higher qualitative score, a granular look at corporate evidence reveals a crucial distinction: the evaluation measures the existence of recovery initiatives, not the actual volume or percentage of materials recycled at scale.
In practice, physical loops remain fragmented and limited:
- Regional Pilots Over Global Scale: Recovery efforts are often confined to specific product lines or geographic pilots (e.g., regional reverse-logistics partnerships for packaging or isolated remanufacturing programs across a subset of customers).
- Incomplete Loop Closure: While 100% of companies engage in recovering some materials, components, or energy from waste streams, only 75.4% feed recovered materials back into their own manufacturing operations to close the loop.
- Volumetric Gaps: Most organizations do not measure or report total post-consumer material volume returned versus virgin materials consumed, leaving the true throughput of closed-loop systems unquantified.
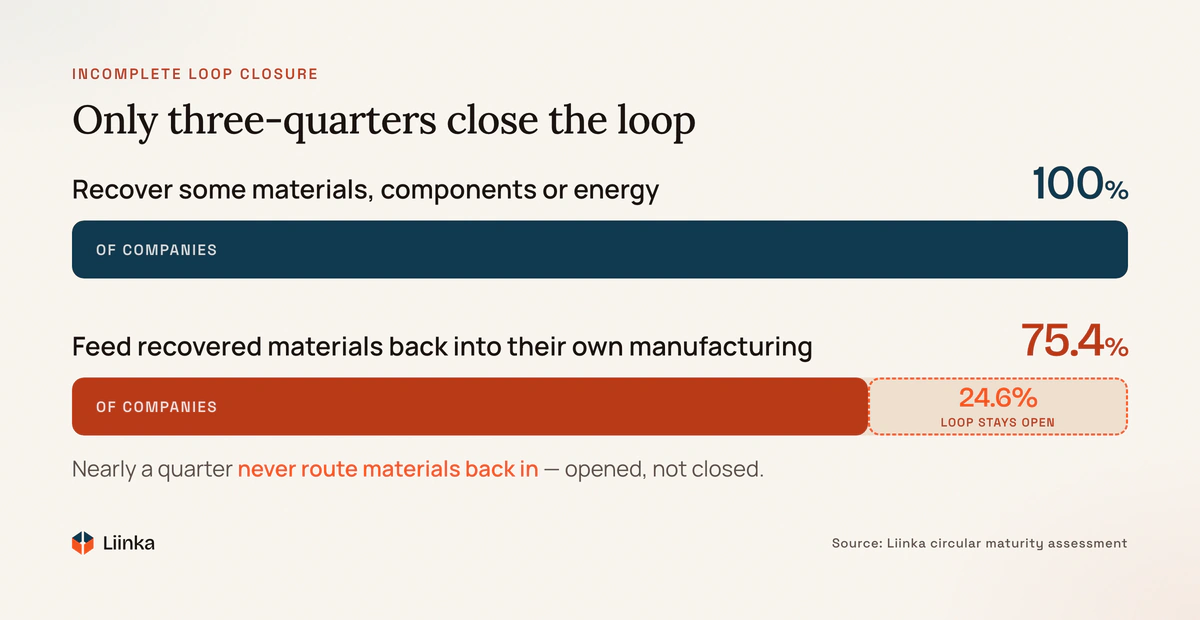
Rather than running fully integrated circular loops, industrial enterprises are primarily operating initial recycling schemes and component-refurbishment pilots.
03
The Digital Mirage: Siloed Data and Unmonetized Capabilities
Digital enablement achieved a high score across evaluated enterprises, driven by product lifecycle assessments (LCAs) and structured material tracking. However, digital maturity on paper does not translate into digital monetization:
- Internal and Compliance-Focused Data: Most product data (such as Environmental Product Declarations or material databases) is stored in internal silos or used strictly to fulfill regulatory compliance and ESG reporting.
- Operational Integration Friction: Data exchange across multi-tier supplier networks remains fragmented, with companies facing persistent data quality and integration challenges.
- Unmonetized Insights: While most companies maintain mechanisms to share sustainability data with partners, almost none use this data to monetize secondary material streams or price lifecycle service offerings.
04
Business Model Stagnation: The "Product-as-a-Service" Holdout
Despite widespread discussion around access-over-ownership and pay-per-use business models:
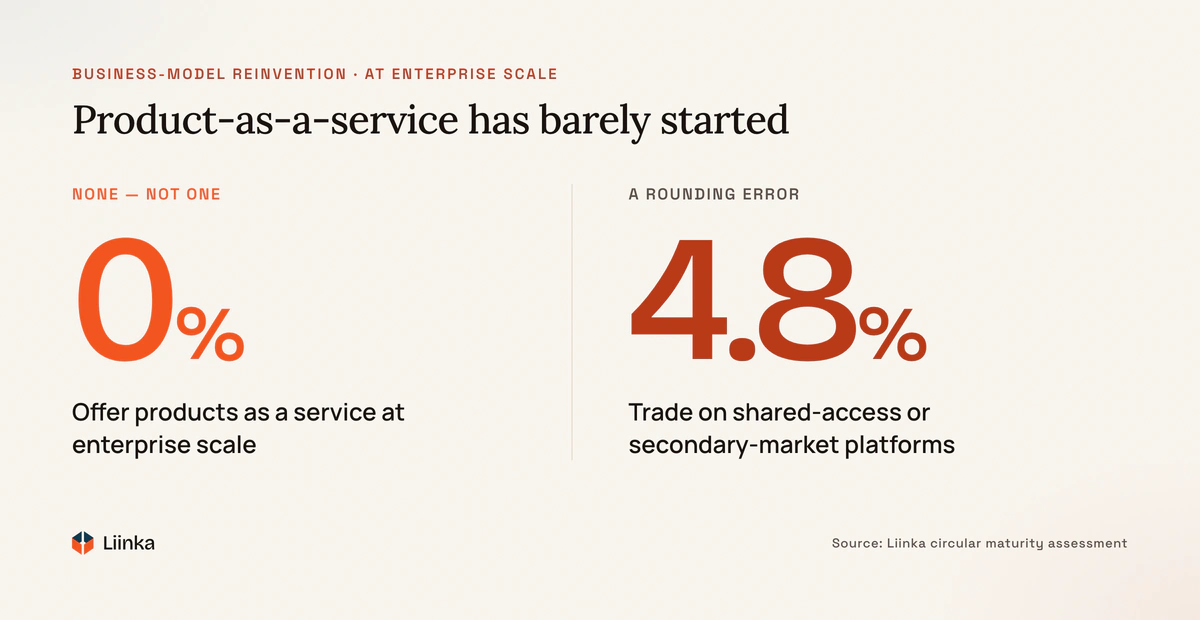
- 0% offer their core products through leasing, rental, subscription, or pay-per-use models at enterprise scale.
- Sharing Platforms Score 4.8%: Participation in shared-access platforms, capacity matching, or secondary marketplace trading is virtually non-existent.
- Commercial Inertia: Even when usage data is collected via IoT monitoring for predictive maintenance, sales departments remain locked into traditional, outright linear sales transactions.
4 Rules to Bridge the Commercial Gap
To move circular initiatives from localized pilots into scalable, financially viable business models, executive leadership must establish commercial rigor:
Assign Commercial Ownership to Corporate Finance: Move circularity financials out of ESG committees and place it directly under CFO oversight. Link finance KPIs directly to circular product margins, working capital efficiency, and asset recovery returns.
Quantify Unit Economics Before Scaling: Prior to committing CapEx to physical recovery infrastructure or expanding pilot schemes, establish the exact cost-to-serve, margin per cycle, and residual asset value per product line.
Audit Actual Recycled Volumes and Closed-Loop Throughput: Shift internal performance tracking from qualitative policy checklists to precise material flow metrics, measuring actual returned volumes and closed-loop secondary content percentages.
Monetize Internal Digital Product Passports: Transform compliance-focused LCA or DPP databases into commercial pricing tools for secondary material markets, component remanufacturing guarantees, and outcome-based service contracts.
Co-founder & CEO, Liinka